The 2026 Outlook for Navy Shipbuilding (Presentation)
1.
Presentation at theBank of America Defense Outlook
and Commercial Aerospace Forum 2026
January 7, 2026
Eric J. Labs
National Security Division
The 2026 Outlook for
Navy Shipbuilding
2.
1
Shipbuilding Requests andAppropriations, 2015 to 2025
The Congress has
consistently appropriated
more funds for
shipbuilding than
Administrations have
requested.
3.
2
Shipbuilding inflation isthe growth in the costs of labor and materials used in building naval ships.
GDP = gross domestic product; SCN = Shipbuilding and Conversion, Navy
Average Annual Increase in GDP Price Inflation,
Shipbuilding Inflation, and the Shipbuilding Budget, 2005 to 2025
The Navy’s shipbuilding
budget has grown almost
twice as fast as
shipbuilding inflation.
4.
3
HAC = HouseAppropriations Committee; HASC = House Armed Services Committee; NDAA = National Defense Authorization Act for 2026;
SAC = Senate Appropriations Committee; SASC = Senate Armed Services Committee.
Congressional Action on Shipbuilding for Fiscal Year 2026
5.
4
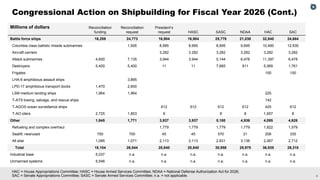
HAC = HouseAppropriations Committee; HASC = House Armed Services Committee; NDAA = National Defense Authorization Act for 2026;
SAC = Senate Appropriations Committee; SASC = Senate Armed Services Committee; n.a. = not applicable.
Congressional Action on Shipbuilding for Fiscal Year 2026 (Cont.)
Millions of dollars Reconciliation
funding
Reconciliation
request
President’s
request HASC SASC NDAA HAC SAC
Battle force ships 16,259 24,773 16,904 16,904 25,778 21,038 32,840 24,684
Columbia class ballistic missile submarines 1,926 8,995 8,995 8,995 9,695 10,490 12,930
Aircraft carriers 3,282 3.282 3,282 3,282 3,282 3,282
Attack submarines 4,600 7,135 3,944 3,944 5,144 6,478 11,397 6,478
Destroyers 5,400 5,400 11 11 7,685 911 5,069 1,761
Frigates 100 100
LHA-6 amphibious assault ships 3,895
LPD-17 amphibious transport docks 1,470 2,600
LSM medium landing ships 1,964 1,964 225
T-ATS towing, salvage, and rescue ships 142
T-AGOS ocean surveillance ships 612 612 612 612 425 612
T-AO oilers 2,725 1,853 8 8 8 1,657 8
Other 1,845 1,771 3,937 3,937 5,180 4,936 4,095 4,626
Refueling and complex overhaul 1,779 1,779 1,779 1,779 1,822 1,579
Sealift: new/used 750 700 45 45 570 21 206 335
All else 1,095 1,071 2,113 2,113 2,831 3,136 2,067 2,712
Total 18,104 26,544 20,840 20,840 30,958 25,975 36,935 29,310
Industrial base 5,037 n.a. n.a. n.a. n.a. n.a. n.a. n.a.
Unmanned systems 5,546 n.a. n.a. n.a. n.a. n.a. n.a. n.a.
6.
5
Tonnage is calculatedusing lightship displacement for surface ships and Condition A-1 weight for submarines. This figure was originally published in Congressional Budget Office,
An Analysis of the Navy’s 2025 Shipbuilding Plan (January 2025), www.cbo.gov/publication/60732.
Amount of Tonnage That Would Be Constructed Under
the Navy’s 2025 Plan
The demands that
the 2025 plan
would place on the
nation’s shipyards
would be greater
than those they
have faced over
the past decade.
Thousands of tons
7.
6
Data provided bythe Bureau of Labor Statistics.
Total Employment in the Shipbuilding and Boatbuilding Industry
Employment in the
shipbuilding and
boatbuilding industry has
not grown since 1990.