Six Sigma is a data-driven approach to process improvement that aims for near perfect product quality. It uses statistical methods to identify and remove defects in manufacturing and business processes. The goal of Six Sigma is to achieve no more than 3.4 defects per million opportunities. Projects follow the DMAIC cycle of Define, Measure, Analyze, Improve, and Control to close gaps between current and target performance. Six Sigma was pioneered by companies like Motorola and GE and helped significantly reduce costs and increase profits through quality improvement.
![• Reducing cycle time.
• Reducing defects.
Three key characteristics separates six sigma from quality programs of the past:
1. Six Sigma is a customer focused.
2. Six sigma projects produce major returns on investments.
3. Six sigma changes how management operates.
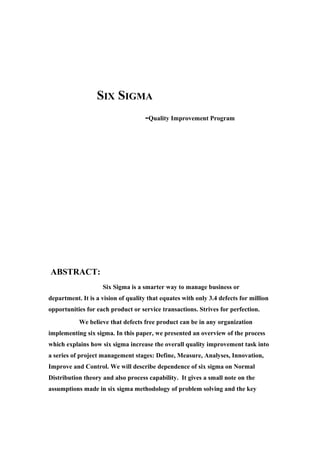
6 SIGMA= 3.4 defects per million
Six Sigma equates 3.4 defects for every million parts made or process
transactions carried out. This quality equates to 99.99966% defect free
products or transactions. High quality standards do make sense but the cost
required to pursue such high standards have to be balanced with benefits
gained. The six sigma processes exposes the root causes and then focuses on
the improvements to achieve the highest level of quality at acceptable cost.
This is essential to achieve and maintain a competitive advantage and high
levels of customer satisfaction and loyalty.
When we say that a process is at six sigma level, such a process is
normally yield two instances of non-conformances out of every million
opportunities for non-conformances, provided there is no shift in the process
average. The same will yield 3.4 instances of non-conformances out of every
million opportunities with an expected of 1.5 sigma in the process average.
This is considered to be best-in-class quality.
THEORY:
Six Sigma relies on the normal distribution theory to predict defect
rates. As we all know, variation is inevitable in any process. The variation
can be due to chance causes that are inherent in the process [chance
variation] or due to assignable causes that are external to the process
[Assignable variation]. If we detect and remove all the assignable causes and
bring the process under the influence of chance causes, then the process is
said to be under statistical control. The process capability (PC) is defined as](https://image.slidesharecdn.com/sixsigmafullreport-130103032426-phpapp01/85/Six-sigma-full-report-3-320.jpg)

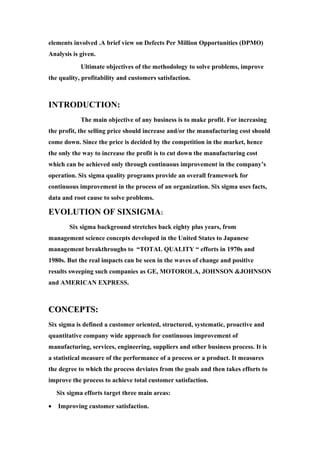
![The process yield represents the proportion of defect- free units
before testing or repair. The Poisson Distribution can be used to calculate the
Yield for a unit if the DPU value is known.
YIELD= e^(-DPU)
If the yield is known for each part or process step, the overall yield for
the process (ROLLED THROUGHPUT YIELD [YRT]) can be computed as
the product of yields of individual process steps. This value will be less than
smallest individual yield since these are all in fractions. This clearly shows
that for improving the YRT, the individual yields shall be improved. In other
words, for minimizing the overall defect rate, the overall defect rate, the
individual defect rates of each part or process step shall be minimized. Hence,
only with six sigma parts and process steps will an organization experience
high YRT for complex products with numerous parts and process steps.
SIX SIGMA -PROBLEM SOLVING PROCESS:
The sigma of the process, which tells us how capable the process is, can be
used to compare similar or dissimilar process. Such comparison, known as
Benchmarking, will uncover what we do well.
MAIC, DMAIC or DMAIIC are all acronyms used to identify six
sigma methodologies by different 6 sigma service providers. The DMAIIC
acronym, which is the “most hybridized” form used by SIX Sigma
Innovation
is described as follows:
DEFINE the problem and the scope of the six sigma project in
detail.
MEASURE and collect data on the problem and its potential root
causes.
ANALYSE the data selected determine the real root cause (s).
INNOVATE – to identify the “best” solutions to the problem.
IMPROVE the process, and then pilot the proposed solution.
CONTROL the new process to ensure that the improvements are](https://image.slidesharecdn.com/sixsigmafullreport-130103032426-phpapp01/85/Six-sigma-full-report-6-320.jpg)


![• Reducing cycle time.
• Reducing defects.
Three key characteristics separates six sigma from quality programs of the past:
1. Six Sigma is a customer focused.
2. Six sigma projects produce major returns on investments.
3. Six sigma changes how management operates.
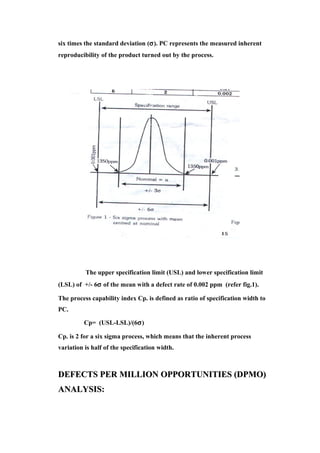
6 SIGMA= 3.4 defects per million
Six Sigma equates 3.4 defects for every million parts made or process
transactions carried out. This quality equates to 99.99966% defect free
products or transactions. High quality standards do make sense but the cost
required to pursue such high standards have to be balanced with benefits
gained. The six sigma processes exposes the root causes and then focuses on
the improvements to achieve the highest level of quality at acceptable cost.
This is essential to achieve and maintain a competitive advantage and high
levels of customer satisfaction and loyalty.
When we say that a process is at six sigma level, such a process is
normally yield two instances of non-conformances out of every million
opportunities for non-conformances, provided there is no shift in the process
average. The same will yield 3.4 instances of non-conformances out of every
million opportunities with an expected of 1.5 sigma in the process average.
This is considered to be best-in-class quality.
THEORY:
Six Sigma relies on the normal distribution theory to predict defect
rates. As we all know, variation is inevitable in any process. The variation
can be due to chance causes that are inherent in the process [chance
variation] or due to assignable causes that are external to the process
[Assignable variation]. If we detect and remove all the assignable causes and
bring the process under the influence of chance causes, then the process is
said to be under statistical control. The process capability (PC) is defined as](/p?url=https%3A%2F%2Fimage.slidesharecdn.com%2Fsixsigmafullreport-130103032426-phpapp01%2F85%2FSix-sigma-full-report-3-320.jpg&__src=https%3A%2F%2Fwww.slideshare.net%2Fslideshow%2Fsix-sigma-full-report%2F15837772&__type=image)


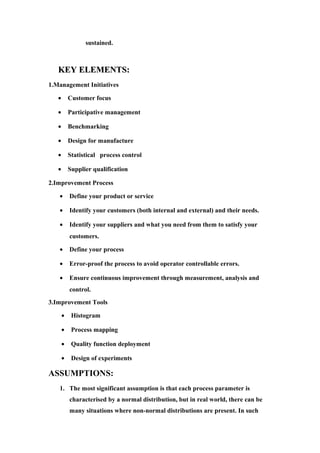
![The process yield represents the proportion of defect- free units
before testing or repair. The Poisson Distribution can be used to calculate the
Yield for a unit if the DPU value is known.
YIELD= e^(-DPU)
If the yield is known for each part or process step, the overall yield for
the process (ROLLED THROUGHPUT YIELD [YRT]) can be computed as
the product of yields of individual process steps. This value will be less than
smallest individual yield since these are all in fractions. This clearly shows
that for improving the YRT, the individual yields shall be improved. In other
words, for minimizing the overall defect rate, the overall defect rate, the
individual defect rates of each part or process step shall be minimized. Hence,
only with six sigma parts and process steps will an organization experience
high YRT for complex products with numerous parts and process steps.
SIX SIGMA -PROBLEM SOLVING PROCESS:
The sigma of the process, which tells us how capable the process is, can be
used to compare similar or dissimilar process. Such comparison, known as
Benchmarking, will uncover what we do well.
MAIC, DMAIC or DMAIIC are all acronyms used to identify six
sigma methodologies by different 6 sigma service providers. The DMAIIC
acronym, which is the “most hybridized” form used by SIX Sigma
Innovation
is described as follows:
DEFINE the problem and the scope of the six sigma project in
detail.
MEASURE and collect data on the problem and its potential root
causes.
ANALYSE the data selected determine the real root cause (s).
INNOVATE – to identify the “best” solutions to the problem.
IMPROVE the process, and then pilot the proposed solution.
CONTROL the new process to ensure that the improvements are](/p?url=https%3A%2F%2Fimage.slidesharecdn.com%2Fsixsigmafullreport-130103032426-phpapp01%2F85%2FSix-sigma-full-report-6-320.jpg&__src=https%3A%2F%2Fwww.slideshare.net%2Fslideshow%2Fsix-sigma-full-report%2F15837772&__type=image)


