Downloaded 85 times


![www.tothenew.com
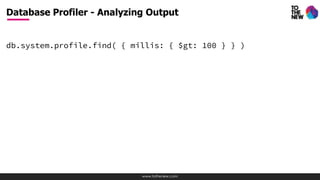
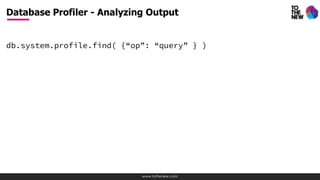
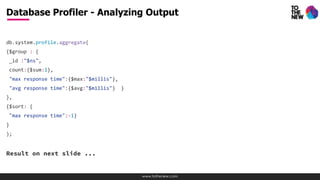
db.system.profile.aggregate({ $group : { _id :"$op",
count:{$sum:1},
"max response time":{$max:"$millis"},
"avg response time":{$avg:"$millis"}
}});
Result:
{
"result" : [
{ "_id" : "command", "count" : 1, "max response time" : 0, "avg response time" : 0 },
{ "_id" : "query", "count" : 12, "max response time" : 571, "avg response time" : 5 },
{ "_id" : "update", "count" : 842, "max response time" : 111, "avg response time" : 40 },
{ "_id" : "insert", "count" : 1633, "max response time" : 2, "avg response time" : 1 }
],
"ok" : 1
}
Database Profiler - Analyzing Output](https://image.slidesharecdn.com/tuioai4jroasqamdhnue-signature-b103d2ebecf5b4a88b093025e8fd81c2a0384f67423c57cfa5b19f7859a95223-poli-170124172125/85/MongoDB-Performance-Tuning-15-320.jpg)
![www.tothenew.com
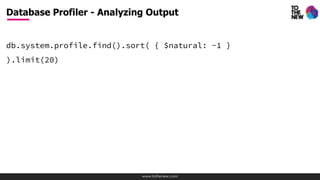
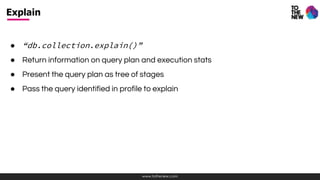
Result:
{
"result" : [
{ "_id" : "game.players","count" : 787, "max response time" : 111, "avg response time" : 0},
{"_id" : "game.games","count" : 1681,"max response time" : 71, "avg response time" : 60}, {"_id"
: "game.events","count" : 841,"max response time" : 1,"avg response time" : 0},
…
],
"ok" : 1
}
Database Profiler - Analyzing Output](https://image.slidesharecdn.com/tuioai4jroasqamdhnue-signature-b103d2ebecf5b4a88b093025e8fd81c2a0384f67423c57cfa5b19f7859a95223-poli-170124172125/85/MongoDB-Performance-Tuning-17-320.jpg)


![www.tothenew.com
db.system.profile.aggregate({ $group : { _id :"$op",
count:{$sum:1},
"max response time":{$max:"$millis"},
"avg response time":{$avg:"$millis"}
}});
Result:
{
"result" : [
{ "_id" : "command", "count" : 1, "max response time" : 0, "avg response time" : 0 },
{ "_id" : "query", "count" : 12, "max response time" : 571, "avg response time" : 5 },
{ "_id" : "update", "count" : 842, "max response time" : 111, "avg response time" : 40 },
{ "_id" : "insert", "count" : 1633, "max response time" : 2, "avg response time" : 1 }
],
"ok" : 1
}
Database Profiler - Analyzing Output](/p?url=https%3A%2F%2Fimage.slidesharecdn.com%2Ftuioai4jroasqamdhnue-signature-b103d2ebecf5b4a88b093025e8fd81c2a0384f67423c57cfa5b19f7859a95223-poli-170124172125%2F85%2FMongoDB-Performance-Tuning-15-320.jpg&__src=https%3A%2F%2Fwww.slideshare.net%2Fslideshow%2Fmongodb-performance-tuning-71338819%2F71338819&__type=image)

![www.tothenew.com
Result:
{
"result" : [
{ "_id" : "game.players","count" : 787, "max response time" : 111, "avg response time" : 0},
{"_id" : "game.games","count" : 1681,"max response time" : 71, "avg response time" : 60}, {"_id"
: "game.events","count" : 841,"max response time" : 1,"avg response time" : 0},
…
],
"ok" : 1
}
Database Profiler - Analyzing Output](/p?url=https%3A%2F%2Fimage.slidesharecdn.com%2Ftuioai4jroasqamdhnue-signature-b103d2ebecf5b4a88b093025e8fd81c2a0384f67423c57cfa5b19f7859a95223-poli-170124172125%2F85%2FMongoDB-Performance-Tuning-17-320.jpg&__src=https%3A%2F%2Fwww.slideshare.net%2Fslideshow%2Fmongodb-performance-tuning-71338819%2F71338819&__type=image)


![www.tothenew.com
...
"winningPlan" : {
"stage" : <STAGE1>,
...
"inputStage" : {
"stage" : <STAGE2>,
...
"inputStage" : {
...
}
}
},
"rejectedPlans" : [
<candidate plan 1>,
...
]
}
Explain - Sample Output](/p?url=https%3A%2F%2Fimage.slidesharecdn.com%2Ftuioai4jroasqamdhnue-signature-b103d2ebecf5b4a88b093025e8fd81c2a0384f67423c57cfa5b19f7859a95223-poli-170124172125%2F85%2FMongoDB-Performance-Tuning-21-320.jpg&__src=https%3A%2F%2Fwww.slideshare.net%2Fslideshow%2Fmongodb-performance-tuning-71338819%2F71338819&__type=image)

![www.tothenew.com
"executionStats" : {
"executionSuccess" : <boolean>,
"nReturned" : <int>,
"executionTimeMillis" : <int>,
"totalKeysExamined" : <int>,
"totalDocsExamined" : <int>,
"executionStages" : {
// on next slide
},
"allPlansExecution" : [
{ <partial executionStats1> },
{ <partial executionStats2> },
...
]
}
Explain - executionStats](/p?url=https%3A%2F%2Fimage.slidesharecdn.com%2Ftuioai4jroasqamdhnue-signature-b103d2ebecf5b4a88b093025e8fd81c2a0384f67423c57cfa5b19f7859a95223-poli-170124172125%2F85%2FMongoDB-Performance-Tuning-23-320.jpg&__src=https%3A%2F%2Fwww.slideshare.net%2Fslideshow%2Fmongodb-performance-tuning-71338819%2F71338819&__type=image)


![www.tothenew.com
db.events.find({ "user_id":35991},{"_id":0,"user_id":1}).explain()
{
"cursor" : "BtreeCursor user_id_1", "isMultiKey" : false,
"n" : 2,
"nscannedObjects" : 2,
"nscanned" : 2,
"nscannedObjectsAllPlans" : 2,
"nscannedAllPlans" : 2,
"scanAndOrder" : false,
"indexOnly" : true,
"nYields" : 0,
"nChunkSkips" : 0,
"millis" : 0,
"indexBounds" : { "user_id" : [ [ 35991, 35991 ] ] },
}
PS: This example is from v2.x of MongoDB
Examples](/p?url=https%3A%2F%2Fimage.slidesharecdn.com%2Ftuioai4jroasqamdhnue-signature-b103d2ebecf5b4a88b093025e8fd81c2a0384f67423c57cfa5b19f7859a95223-poli-170124172125%2F85%2FMongoDB-Performance-Tuning-26-320.jpg&__src=https%3A%2F%2Fwww.slideshare.net%2Fslideshow%2Fmongodb-performance-tuning-71338819%2F71338819&__type=image)


This document discusses tuning MongoDB performance. It covers tuning queries using the database profiler and explain commands to analyze slow queries. It also covers tuning system configurations like Linux settings, disk I/O, and memory to optimize MongoDB performance. Topics include setting ulimits, IO scheduler, filesystem options, and more. References to MongoDB and Linux tuning documentation are also provided.


![[NDC17] Kubernetes로 개발서버 간단히 찍어내기](https://cdn.slidesharecdn.com/ss_thumbnails/ndc-170529041601-thumbnail.jpg?width=640&height=640&fit=bounds)