Download as PDF, PPTX


![Work on Unimportant Things
★ [DO] Apply Amdahl's Law: a 5% time consumer can't
benefit you more than 5%.
★ [DON’T] Apply "best practices"
✦ These can have unexpected side effects.
✦ Example: I see many sort_merge_passes, maybe I need to
increase sort_buffer_size.
✦ Example: I've heard that I should put the logs and data on
different disks.
60](/p?url=https%3A%2F%2Fimage.slidesharecdn.com%2Fdiagnosingmysqlperformanceproblems-110411030628-phpapp01%2F85%2FDiagnosing-MySQL-performance-problems-60-320.jpg&__src=https%3A%2F%2Fwww.slideshare.net%2Fslideshow%2Fdiagnosing-mysql-performance-problems%2F7584430&__type=image)


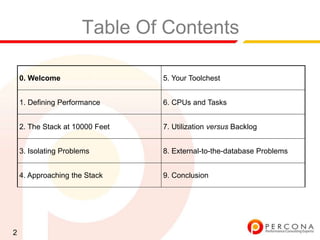
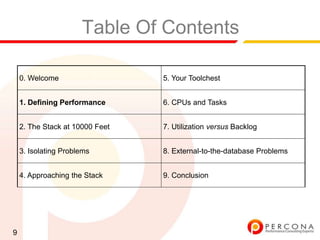
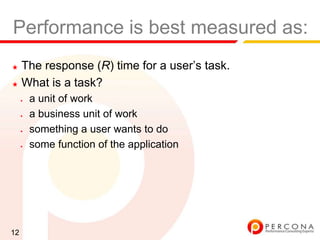
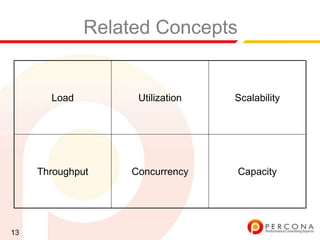
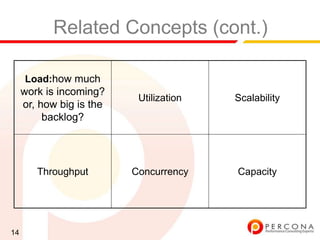
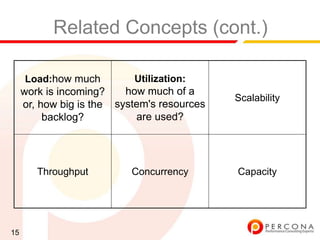
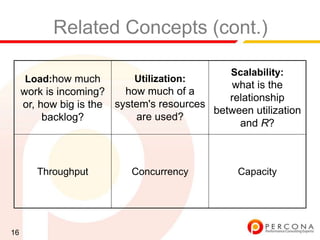
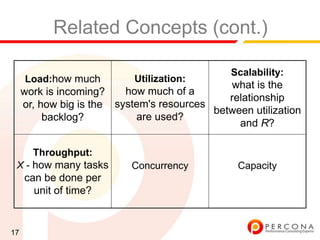
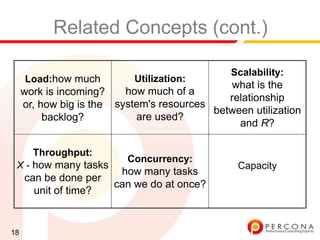
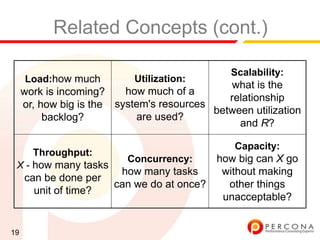
The document provides an overview of diagnosing and fixing MySQL performance problems. It discusses defining performance as response time rather than metrics like CPU usage. It also covers related concepts like load, utilization, throughput, concurrency, scalability and capacity. The document emphasizes starting with a performance goal, following the flow of information between system components, and using tools to isolate specific problems.


![Workload design[1]](https://cdn.slidesharecdn.com/ss_thumbnails/workloaddesign1-130603070133-phpapp02-thumbnail.jpg?width=640&height=640&fit=bounds)


